Measuring Crop Health From The Sky Just Got Easier
A single pixel in satellite imagery will allow farmers to see exactly how their crops are performing down to a single acre with highly detailed maps.
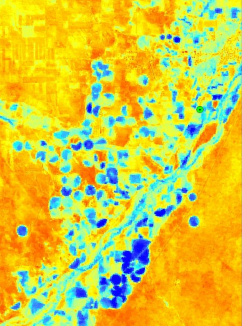
A computer model created from satellite imagery shows the rate of evapotranspiration. The images are very high resolution, and readers can zoom closer in to get a detailed look.

A computer model created from satellite imagery shows the rate of evapotranspiration. The images are very high resolution, and readers can zoom closer in to get a detailed look. (Aymn Elhaddad, Ph.D. / Colorado State University at Fort Collins)
Research scientist Aymn Elhaddad presented a process at the 2014 ESRI User Conference in San Diego for creating maps built from various light spectrums to measure the rate of "evapotranspiration."
The ESRI User Conference is an annual gathering devoted to cartography and draws nearly 15,000 people from virtually every industry. ESRI produces mapping software and other geographic information systems, or GIS, products.
The Midwest Center for Investigative Reporting attended the conference this past week to scout new visualizations in agribusiness.
Measuring evapotranspiration created from NASA Landsat satellite imagery will allow farmers to check on the health of their fields on a day-to-day basis. It will also allow farmers to assess damage after a storm.
Businesses catering to the agricultural sector will also see benefits, including irrigation providers needing to know how much water to deliver and government agencies looking to anticipate the amount of relief needed during a water shortage or disaster.
In layman's terms, evapotranspiration can be understood as the difference in the amount of water within a plant compared to the amount in the air surrounding it.
Traditional methods for estimating water consumption are calculated using a series of indexes and measurements of rainfall.
But these calculations assume crops are healthy and the ground is saturated after a rainfall, which is not always the case, said Elhaddad. Such assumptions often lead farmers to apply too little or not enough water to their crops.
Elhaddad is a member of the Integrated Decision Support team at Colorado State University, the group responsible for pioneering the new approach, which builds upon the traditional methods using data extracted from the satellite imagery.
In published research looking at water supplied by the Palo Verda Irrigation District in southern California, Elhaddad believes irrigation could have been reduced by more than 16 percent using the new methodology compared to traditional means.
Though more than 20 years of imagery is freely available from NASA's website, some computer systems are required to analyze and produce the imagery, a process that currently take about one hour to produce.
Ultimately, Elhaddad estimates final cost to farmers will be 50 cents per acre per year.

